
The average Reigate & Banstead home sold for £485,856 in August, and July's fall has been revised away. Rents average £1,652 a month, up 3.2% on a year.
The average home in Reigate & Banstead sold for £485,856 in August 2026, up 0.3% on a year earlier. The figure comes from HM Land Registry’s house price index, published on 21 October.
Last month we reported a fall. That fall has now gone. July was first published at £480,824, down 0.4% on a year. With late sales now registered, July stands at £484,165, up 0.3%.
Rents are rising faster than prices. The Office for National Statistics put the average private rent in the borough at £1,652 a month in September, up 3.2% on a year.
One caution first. The house price index is a mean average, not a median, so a handful of expensive sales pull it up. It is built from completed sales, so August’s figure mostly reflects deals agreed in the spring.
House prices: flat, not falling
A year ago, in August 2025, the average home in the borough sold for £484,205. August’s £485,856 is £1,651 higher.
The July revision is large for a single month. It added £3,341 to the average and turned a fall into a rise. That is why we read one month’s local figure with care, and why the next release can move this one too.
Three of the four property types rose over the year:
| Type | Average, August 2026 | Change on a year |
|---|---|---|
| Detached | £926,802 | +0.5% |
| Semi-detached | £544,539 | +1.7% |
| Terraced | £434,240 | +1.3% |
| Flat | £270,148 | -1.8% |
Semis and terraces, the homes most families buy, are doing best. Flats are the only type still falling.
First-time buyers paid an average of £370,621, up 0.3%. People moving on from a home they already owned paid £608,055. Buyers with a mortgage paid £491,113, and cash buyers £469,092.
The number of sales is still low. The latest published count is 139 sales in the borough in June 2026, against 155 in June 2025. The Land Registry holds back the two most recent months while records come in.
Where the borough sits in Surrey
Reigate & Banstead is the fifth cheapest of Surrey’s 11 districts to buy in. The county average is £524,334, so a home here costs about £38,500 less than the Surrey average.
Over the year, the borough sits in the middle:
- Epsom and Ewell rose fastest, up 3.2% to £566,163
- Surrey Heath rose 1.5% to £457,981
- Mole Valley rose 1.4% to £552,344
- Reigate and Banstead rose 0.3% to £485,856
- Tandridge fell 1.1% to £506,774
- Woking fell furthest, down 2.7% to £437,628
Surrey as a whole fell 0.2%. England rose 0.4% to £293,525.
Tandridge, our eastern neighbour, is still dearer than this borough by about £20,900.
Rents: up 3.2%, a slower climb
The average private rent in Reigate & Banstead was £1,652 a month in September 2026, according to ONS. A year earlier it was £1,600, so a typical tenant now pays £52 a month more.
Rent rises here have slowed sharply over two years:
- September 2024: up 8.7% on a year
- September 2025: up 4.3%
- September 2026: up 3.2%
August 2026 was the low point, at 2.3%. September’s figure is a pick-up from that.
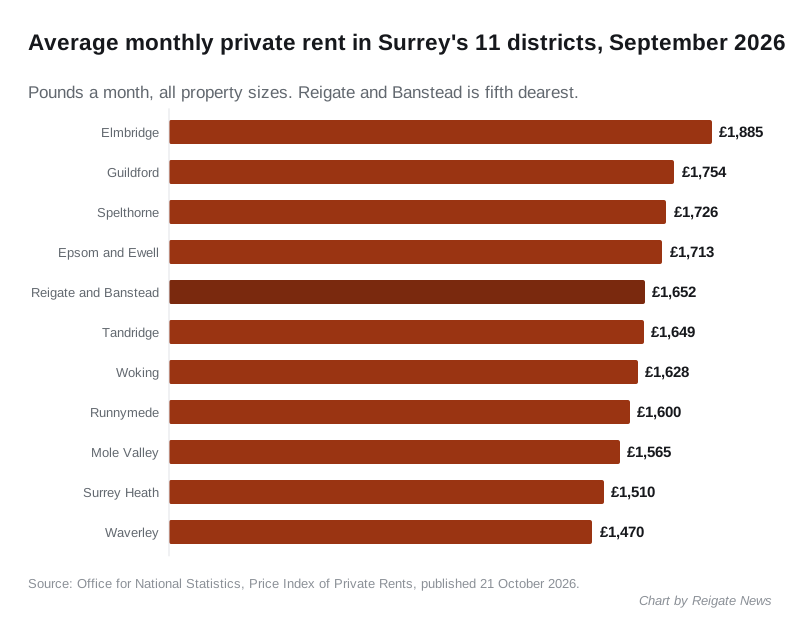
Renting here costs more, relative to the county, than buying does. The borough is the fifth dearest of Surrey’s 11 districts to rent in, behind Elmbridge (£1,885), Guildford (£1,754), Spelthorne (£1,726) and Epsom and Ewell (£1,713). Tandridge is just £3 cheaper at £1,649. The South East average is £1,438.
Rents rose fastest in Spelthorne (7.1%), Tandridge (5.7%) and Guildford (5.7%). They fell in Woking (down 1.0%) and Waverley (down 0.6%).
What a tenant in the borough paid on average in September, by size:
| Size | Average monthly rent |
|---|---|
| One bedroom | £1,149 |
| Two bedrooms | £1,493 |
| Three bedrooms | £1,832 |
| Four or more bedrooms | £2,578 |
By type, the average flat or maisonette let for £1,327, a terraced house £1,666, a semi £1,764 and a detached house £2,414. ONS says terraced rents rose 3.6% over the year, the fastest of any type here, and flats 2.9%.
What it means for you
If you are buying, prices are about where they were a year ago. A semi or terrace costs slightly more than last summer. Flats are almost 2% cheaper, so that is where there is most room to negotiate. Check the council tax band before you offer.
If you are selling, the spring fall that July seemed to show did not happen. Price off this summer’s sold prices on your street, and expect a flat to take longer to sell than a house.
If you rent, increases are running at well under half the pace of two years ago. A landlord asking for much more than 3% at renewal is asking for more than the borough average. Rents vary street by street, so compare listings for the same size of home.
The next figures, house prices for September and rents for October, are due from the Land Registry and ONS in mid November. Our Reigate house prices page has the longer run and the practical detail.
Sources
- HM Land Registry, UK HPI full data file, August 2026 (the borough’s averages by type and buyer, the revised July figure, sales volumes, and the Surrey, England and district figures)
- HM Land Registry, UK House Price Index for August 2026, 21 October 2026
- Office for National Statistics, Housing prices in Reigate and Banstead, updated 21 October 2026
- Office for National Statistics, Price Index of Private Rents, UK: monthly price statistics, 21 October 2026 edition (the borough’s rents by size and type, the Surrey ranking and the series since 2023)
Have your say