
The borough average fell 0.4% in the year to July, and Tandridge has overtaken it again. Flats are down 2.7%; the first-time buyer average is £366,453.
The average home in Reigate & Banstead sold for £480,824 in July 2026, £1,705 less than a year earlier. That is a fall of 0.4%, and it is the borough’s first annual fall since March.
The figures come from the HM Land Registry UK House Price Index for July 2026, published on 16 September. The next release, covering August, is due on 21 October.
One caveat to carry through everything below. UKHPI is a mean average, not a median, so a handful of large sales pull it upward. The figures are also provisional. June was first published at £480,481 and has since been restated at £481,089, a £608 revision in a single month.
Six Surrey districts fell, and this is one of them
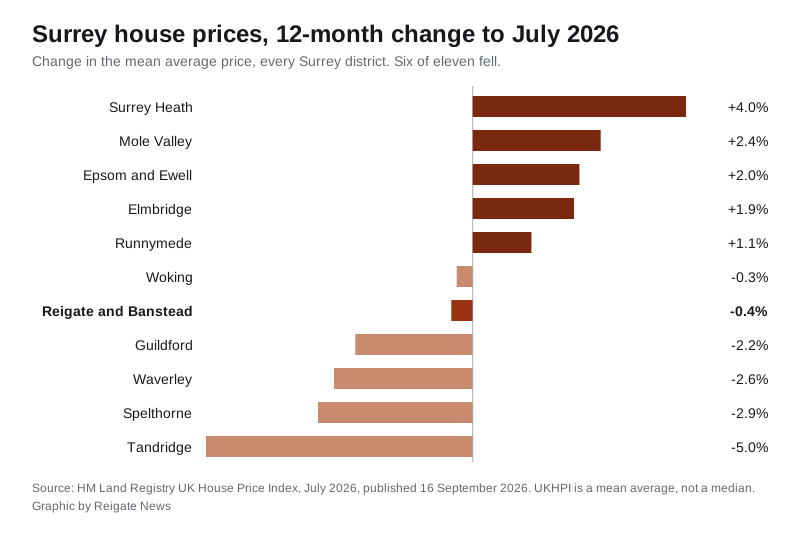
In June this borough was one of five Surrey districts where prices had risen over the year. In July it is one of six where they have fallen.
| District | Average, July 2026 | 12-month change |
|---|---|---|
| Surrey Heath | £457,988 | +4.0% |
| Mole Valley | £555,858 | +2.4% |
| Epsom and Ewell | £568,214 | +2.0% |
| Elmbridge | £748,080 | +1.9% |
| Runnymede | £477,182 | +1.1% |
| Woking | £439,916 | -0.3% |
| Reigate and Banstead | £480,824 | -0.4% |
| Guildford | £532,917 | -2.2% |
| Waverley | £553,429 | -2.6% |
| Spelthorne | £439,609 | -2.9% |
| Tandridge | £482,599 | -5.0% |
Surrey as a whole averaged £522,523, also down 0.4%. England averaged £293,479 and rose 1.1%, so the county is going one way and the country another.
Tandridge has overtaken us again
The most striking line in the table is the one that has crossed over. Last month’s index put Tandridge at £475,344, £5,137 below this borough. The July index puts Tandridge at £482,599, £1,775 above it.
That is not because Tandridge is recovering. Tandridge is the worst performer in Surrey, down 5.0% over the year. It has crossed back over because Reigate & Banstead has stopped rising, not because its neighbour has started.
The district immediately east of Redhill shares the same commuter geography and much of the same line into London. When the two swap places twice in three months on a mean average, that is a reminder of how little separates them and how loose the measure is.
Two markets, pulling apart
The borough average hides four property types moving at different speeds:
| Type | Average, July 2026 | 12-month change |
|---|---|---|
| Detached | £920,076 | -0.1% |
| Semi-detached | £539,040 | +1.2% |
| Terraced | £429,084 | +0.6% |
| Flat or maisonette | £266,872 | -2.7% |
Flats are the story, and they have been for months. At £266,872 the average borough flat is now £7,380 cheaper than a year ago, and the flat index has fallen further than any other type here. Across Surrey the flat average fell 2.8%, so this is a county-wide pattern rather than a local one.
Semi-detached homes are the only type rising by more than a rounding error. Detached homes, the top of the market and the segment where a handful of sales moves the mean most, are flat at -0.1%.
The first-time buyer average was £366,453, down 0.5% on the year. That is £114,371 below the borough average, because first-time buyers overwhelmingly buy the flats and terraces at the bottom of the range.
The year in one line
The run of monthly averages shows a market that fell hard over the winter, recovered through the spring and has drifted since May:
- July 2025: £482,529
- October 2025: £488,082
- January 2026: £469,009
- April 2026: £486,530
- May 2026: £482,187
- June 2026: £481,089
- July 2026: £480,824
Three consecutive monthly falls since April, none of them large. The July move on June was -0.1%, which on a mean average of this size is noise. The twelve-month comparison is the one that has turned.
What it means for you
- If you are selling, the borough average is now below where it was a year ago. Price against the last three months, not against last autumn’s £488,082 peak.
- If you are buying a flat, this is the only segment in the borough with a meaningful fall behind it, down 2.7% over the year.
- If you are a first-time buyer, the figure to work from is £366,453, not the headline £480,824.
- Do not treat any of this as final. June moved £608 on revision a month after publication. August’s figures land on 21 October.
- Our Reigate house prices page carries the longer run and the practical detail, and Reigate council tax bands covers what you pay once you are in.
Sources
- UK House Price Index for July 2026, HM Land Registry, published 16 September 2026, for the release and its date.
- UK House Price Index, Reigate and Banstead, for the borough average, the monthly series, the breakdown by property type and the first-time buyer average.
- UK House Price Index, Surrey, for the county average and the eleven district figures in the table above.
More from Reigate News: Reigate house prices, June’s index, when the borough was still rising and Reigate planning applications.
Have your say