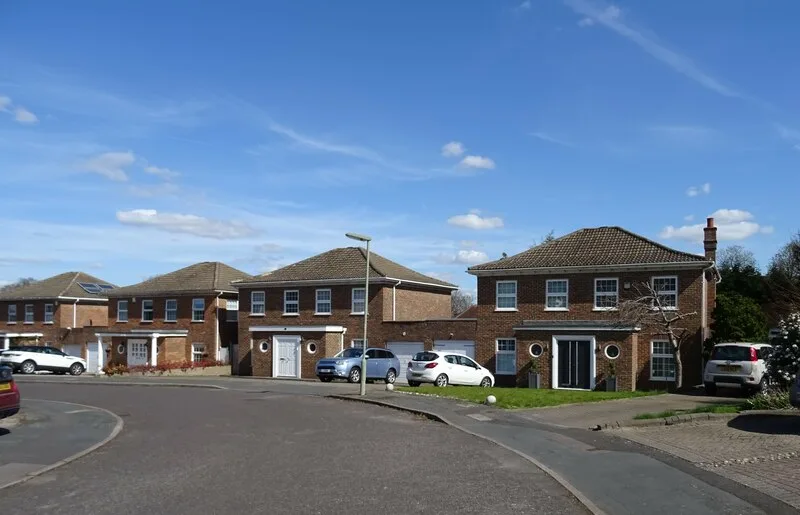

The average Reigate & Banstead home sold for £480,481 in June. It was one of only five Surrey districts out of 11 where prices rose over the year. Next-door Tandridge fell 5.6%.
The average home in Reigate & Banstead sold for £480,481 in June 2026, up 0.4% on a year earlier. That sounds like a shrug. It is not, because Surrey as a whole went the other way.
The county average fell 1.2% over the same twelve months. Only five of Surrey’s eleven districts recorded a rise, and Reigate & Banstead was one of them. The figures come from the HM Land Registry UK House Price Index, published on 19 August.
One caveat to carry through everything below. UKHPI is a mean average, not a median, so a handful of large sales pull it upward. The figures are also provisional and get revised as late-registered sales arrive. The May figure reported at £483,340 a month ago has already been restated at £481,664.
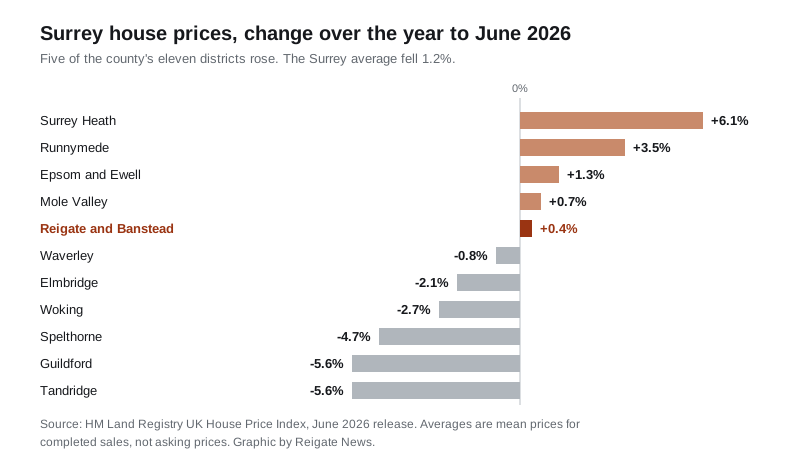
Where the borough sits in Surrey
The twelve-month change in the average price to June 2026, for every Surrey district:
| District | Average price | Change on the year |
|---|---|---|
| Surrey Heath | £461,396 | +6.1% |
| Runnymede | £489,116 | +3.5% |
| Epsom and Ewell | £568,810 | +1.3% |
| Mole Valley | £540,160 | +0.7% |
| Reigate and Banstead | £480,481 | +0.4% |
| Waverley | £560,596 | -0.8% |
| Elmbridge | £743,525 | -2.1% |
| Woking | £433,790 | -2.7% |
| Spelthorne | £429,916 | -4.7% |
| Guildford | £523,974 | -5.6% |
| Tandridge | £475,344 | -5.6% |
Reigate & Banstead is fifth of eleven for growth and fifth of eleven for price. It is a middling borough in a county having a bad year, which is a better place to be than it sounds.
The contrast with Tandridge is the sharpest one on our doorstep. The district immediately east of Redhill, which shares much of the same commuter geography and the same line into London, is down 5.6% on the year to an average of £475,344. A year ago Tandridge averaged £503,722, some £25,164 more than this borough. It is now £5,137 less. That is a £30,301 swing in twelve months between two neighbouring districts.
Set against the wider picture, the borough is behind the national trend but ahead of the regional one:
- England: £293,262, up 1.8%
- United Kingdom: £272,188, up 2.0%
- South East: £380,380, up 0.3%
- Surrey: £519,877, down 1.2%
Across all 295 local authority districts in England, 62 recorded a fall over the year. Reigate & Banstead ranks 76th from the bottom of those 295, so it is in the weaker third nationally while still being in the stronger half of its own county. Both things are true, and they say more about the South East than about the borough.
Flats and detached homes are the drag
The borough average hides two markets moving in opposite directions:
- Semi-detached: £538,541, up 1.8%
- Terraced: £427,920, up 1.6%
- Detached: £916,670, down 0.4%
- Flats: £267,826, down 1.0%
Flats have now been the weakest type in this borough for several months. Detached homes joining them is newer. A year ago the detached average was rising; it is the top of the market, and it is where a small number of transactions moves the mean most, so treat the 0.4% as soft.
The first-time buyer average was £366,504, up 0.7% on the year. That is the figure to hold onto if you are trying to get in: it is £113,977 below the borough average, because first-time buyers overwhelmingly buy the flats and terraces at the bottom of the range, and those are the two segments not running away.
The month itself was flat to down
Prices in the borough fell 0.2% between May and June. The run of monthly averages since last summer shows a market that dipped hard over the winter and has spent 2026 recovering to roughly where it started:
- June 2025: £478,558
- December 2025: £471,406
- January 2026: £469,058
- April 2026: £486,826
- June 2026: £480,481
Thirteen months of movement has produced £1,923 of growth. In a borough where the average is nearly half a million pounds, that is a market standing still rather than one falling.
How many homes are actually selling
Land Registry sales volumes lag prices by about three months, so June and May are still blank. April 2026 is the most recent published count: 102 sales in the borough, against 137 in March.
The comparison with 2025 needs care, because the stamp duty threshold changed on 1 April 2025 and pulled completions forward into March:
- March 2025: 427 sales
- April 2025: 81 sales
- March 2026: 137 sales
- April 2026: 102 sales
That March 2025 spike is a tax deadline, not a boom, and any year-on-year comparison running through it will be nonsense. The steadier read is that spring 2026 is running at a similar level to spring 2025 once the distortion is stripped out.
What it means for you
If you are selling, the borough average has moved £1,923 in thirteen months. Pricing to last summer’s asking prices is pricing to a market that has not grown. Semi-detached and terraced sellers have the better hand; detached and flat sellers do not.
If you are buying, the first-time buyer average of £366,504 and the terraced average of £427,920 are the realistic entry points. Both rose by less than inflation over the year.
If you are comparing areas, Tandridge next door is down 5.6% and now averages £5,137 less than this borough, having been £25,164 more expensive a year ago. It is worth knowing before you assume Redhill and Nutfield price the same way.
A note on what these figures are. UKHPI covers completed sales registered with the Land Registry, not asking prices, and it covers the whole borough, so Reigate town and Horley are averaged together with Banstead and Tadworth. Our Reigate house prices page breaks the borough down by town and postcode sector, and our Reigate planning applications page tracks what is being built.
Sources
- UK House Price Index, Reigate and Banstead, June 2026, HM Land Registry
- UK HPI full data file, June 2026 (CSV), the source for every district and national comparison above
- About the UK House Price Index, HM Land Registry, on revisions and the mean average
Have your say